
One of the technical reasons holding back the uptake of Internet of Things (IoT) products is poor battery life. So, how can the power consumption of an embedded system be analysed and optimised in enough detail to deliver ‘reasonable’ battery life?
According to Vanja Samuelsson founder of Qoitech, a Swedish start-up owned by Sony: “There’s a gap in the market for an affordable development tool that’s suitable for the IoT. The IoT is extremely complex and many of the people creating solutions are inexperienced.
“While power has always been crucial, from a hardware perspective these devices require layers of software to operate. This can mean that choosing the wrong protocol or a failure to take into account the impact of software updates can help to ruin the overall user experience.”
Power measurement tool
“Looking for greater simplicity, Qoitech has developed Otii which allows quick and simple power measurement analysis and comparison, providing a clear link between measurements and code execution. It offers an integrated method for performing automated measurements and testing,” explains Samuelsson.
Otii, with its hardware unit Arc and associated multi-platform desktop application, enables embedded software developers to power-optimise their application, while hardware developers can make informed choices during their power conversion and battery management component selection.
“In low-power embedded systems the choice of SoC or MCU is perhaps the most significant, and semiconductor vendors have taken many approaches to saving power. Sometimes peripherals, coupled with a direct memory access (DMA) controller, move data to and from SRAM without the processor needing to be active. But from the microcontroller’s datasheet alone that is hard to assess,” says Samuelsson.
Another challenge surrounds oscillator stabilisation after wake-up. A clock peripheral using a quartz crystal will need time to stabilise before the processor can start processing instructions after being woken up. If a phase-locked loop (PLL) is included, perhaps offering higher clock frequencies, this also needs time to lock, taking additional time. Different microcontrollers offer different solutions and the one that truly delivers the lowest power consumption is normally found through part experience, part luck.
The Otii Arc is a single piece of hardware that delivers a programmable power source, wide dynamic range current measurement, and additional side measurement and data capture channels.
By providing control over the supply voltage while measuring the current consumption, various power source strategies can be evaluated. If the impact of sub-circuitry needs to be understood, the differential analogue input on the expansion connector, together with a small resistance in the supply line, allows the power impact to be clearly separated out from the total power consumption.
The second key element, according to Samuelsson is the serial data RX input of the expansion port. Serial communication data can be captured via this interface at rates of 9600 bits per second (bps) up to 4Mbps. Any logging messages output by the application are then time-stamped and synchronised with the other time-domain measurements. A real-time operating system (RTOS)-based application could, together with instrumented trace logging via a UART, be tracked as it switched between tasks and into and out of its idle-task and low-power modes. The final element is the single-ended analogue input that is available when differential-mode power measurements are not being made.
This can be used to capture any analogue or digital signal, allowing a simple toggled general-purpose input/output (GPIO) pin to be monitored.
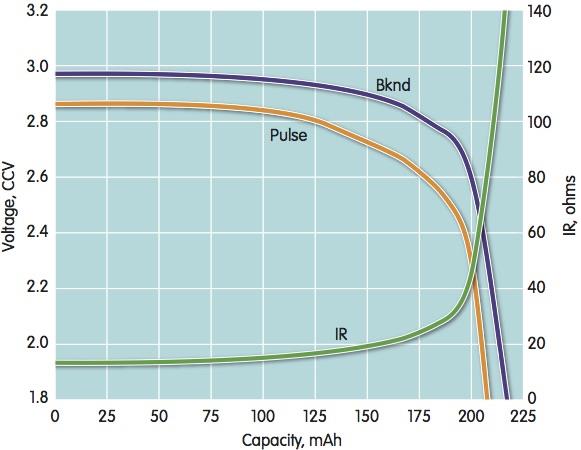
| Above: An example of pulse discharge characteristics |
Analysis made simple
“The Otii software makes the analysis of power consumption simple. Split into three sections; a side bar, where recordings and visualisations can be configured, a graph area, and a log view,” says Samuelsson.
In order to easily understand the relationship between power consumption and application execution, the graph and log views are linked to one another. Minimum, maximum, average and energy measurements also automatically update as the highlighted measurement area or spot-point are moved around. Searching for key moments in the application’s execution is simplified with the search function within the serial output’s log data.
Since IoT nodes cannot function in insolation, it is often the case that power consumption measurements are needed for several nodes simultaneously. In certain mesh configurations, some devices may take on the role of a gateway, resulting in higher power consumption than a device functioning simply as a node.
The Otii software can differentiate between several connected Otii Arc tools, even allowing the user to give them individual names, thus, ensuring usability when quickly switching between the various pieces of hardware being measured.
Other advanced features include battery cell simulation and scripting support. The integrated battery simulator allows one of several different types of batteries to be selected instead of defining a fixed supply voltage. Each battery selected, results in the display of its key parameters together with the manufacturer’s discharge curve. Through use of a slider, the developer can also define the level of discharge of the cell, which is ideal for understanding an application’s reaction to the voltage drop that occurs in the last 10-20% of a battery’s life.
By using the industry standard Lua language, serial data from log files captured outside of the Otii software can be imported.
“Providing these log files contain time-stamping information, it is possible to convert them into the Otii format for import into the GUI,” explains Samuelsson.
Two example scripts are provided that handle Android ADB or Linux Kernel logs. The scripts are also available in the installation folder, allowing them to be used as the basis for modified scripts. In case the time domain of power measurements and the log files do not match, the log view also provides an option to apply either a positive or negative offset in milliseconds, allowing data to be quickly synchronised to power measurement recordings.
Battery profiling can also be undertaken using scripting.
A cell manufacturer’s datasheet tends to provide a combination of constant load discharge, constant current discharge and pulsed load discharge curves, normally at or around room temperature. Since the developer’s application is unlikely to closely fit any of these off-the-shelf discharge characteristics, a hand-crafted test can be scripted.
Such tests consist of a loop that applies different loads for different time periods while logging the cell’s voltage.
“The test can be halted either upon reaching a set number of iterations, or when the cell’s voltage has reached a lower limit,” according to Samuelsson.
Toward the end of product development, it is also useful to run longer-term tests or even set up an automated testing capability. Here, the scripting capability coupled with execution of the Otii software from the command-line interface can be used. Hand-built test harnesses or even build and testing environments, such as Jenkins, can be used to trigger and monitor such test runs.
“When it comes to developing products for the IoT, developers need the best insights into power consumption possible during each cycle of the product creation process whether that’s system design and architecture, silicon selection, development and testing,” says Samuelsson.
The Otii Arc hardware, with its large dynamic range, together with the Otii software – featuring a simple and clean interface – has been designed to make it easy to link moments of an application’s high-energy usage to specific sections of application code, microcontroller or SoC configuration, or sub-system circuitry state.


