It is important that power measurements can be repeatable, which demands instruments offering a combination of accuracy, repeatability, and traceability – that is, a common definition of an absolute value for a power measurement.
Power measurement equipment
Two key instruments for making field power measurements are power sensors and spectrum analysers. There are several ways to connect a power sensor to a measurement and display system such as a traditional power meter, laptop or spectrum analyser, as shown in Figure 1.
The choice of power measurement equipment involves a trade-off between accuracy, frequency range, dynamic range, portability, durability and warm-up time. This article reviews the trade-offs involved in using a power sensor or an analyser’s built-in channel power meter to make field measurements of signal power.
Power sensors and signal processing
A typical power sensor and meter includes a sensor element followed by analogue and digital signal-processing components, as shown in Figure 2. The sensor element converts the incoming RF/microwave signal to a DC or low-frequency voltage waveform of around 100nV, which is then amplified and filtered. In some configurations, the filter bandwidth can be reduced to improve measurement sensitivity, or increased to improve measurement speed. The analogue signal is then digitised using the analogue-to-digital converter (ADC). A microprocessor handles additional filtering and time averaging of the sampled waveform, as well as interfacing to the keypad and display.
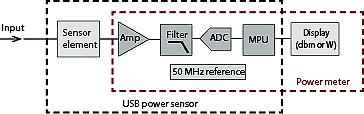
Figure 2: Block diagram of a power sensor and power meter
When using a power sensor with a separate power meter, signal processing is handled in the meter, as shown in the red box in Figure 2. When using a USB-based power sensor, signal processing is handled in the power sensor (black box). Peak power sensors often have extra signal paths to process average and peak measurements separately.
In general, power sensors have the highest measurement accuracy but require zeroing and user calibration to correct for frequency response, temperature drift and sensor aging. For example, Keysight power sensors and meters include a 50 MHz reference oscillator for this purpose, whose output power is controlled to ±0.4%.
RF/microwave power sensing is usually done with thermal or diode-based detectors.
Thermal power sensors
Thermal sensors use the energy captured from the RF/microwave signal to change one of their electrical properties. They respond to the total power in the signal and report its true average power, regardless of modulation. The sensor element can be thermistor or thermocouple based.
When thermistors are subjected to an RF input, they warm up and their resistance drops, which can be accurately measured in a bridge circuit. Drawbacks of thermistors include low RF measurement sensitivity, down to approximately -20 dBm, and slow operation. They also need to be connected to a power meter and are sensitive to ambient temperatures.
In thermocouples, temperature changes generate a voltage change that can be directly measured. Thermocouples are more rugged and less sensitive to ambient temperature than thermistors, making them more useful for field measurements. Their sensitivity is slightly greater, at approximately -35 dBm, but they need access to a reference oscillator to calibrate for temperature drift and sensor aging.
Diode-based power sensors
Diode-based sensors have a wider dynamic range than thermal-based sensors, but their non-linear characteristics need compensation in order to achieve accurate average and peak power measurements.
Diode-based sensors rectify and filter the input RF/microwave signal using a diode and capacitor, as in Figure 3.
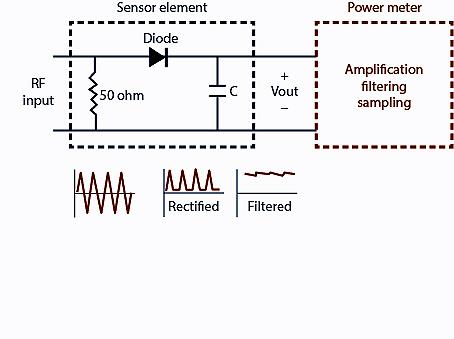
Figure 3: Diode rectification and filtering of an RF input
Diode-based sensors mainly operate in a region where the detected output voltage is proportional to the square of the input voltage and therefore directly proportional to the input power. In this region, the relationship between input power and output voltage is linear. Within this region, from -70 dBm to -20 dBm of input signal, both the average and peak power of any modulated waveform can be accurately measured. Above 0 dBm, the diode characteristic shifts from a power-to-voltage relationship to a linear voltage-to-voltage relationship, through a transition region from –20 dBm to 0 dBm.
Diode-based power sensors also need access to a reference oscillator for calibration. For highest accuracy, they should warm up for 30 minutes before use and they are sensitive to ESD and mechanical shock.
Diode-based power sensors in use
Let’s look at three different uses of a diode-based power sensor.
Measuring the average power of CW signals
With the right signal processing and compensation techniques, the dynamic range of a diode-based sensor can be more than 90 dB. This is often achieved using correction factors held in non-volatile memory to compensate for variations in input power, temperature and frequency.
Measurements in the higher-power transition and linear regions are only accurate for CW signals. Possible applications for this kind of measurement include testing frequency sources or the output power from amplifiers and any associated gain compression. CW-only sensors, such as the Keysight E4412/13A, have the lowest sensitivity and highest dynamic range of all the sensor types.
Measuring the average power of modulated signals
The correction factors used in the transition and linear region of a diode-based sensors are not accurate enough to enable the sensor to correctly report the average power of pulsed and digitally modulated waveforms.
One way around this is to attenuate a high-power signal so it is measured in the square-law region of the sensor, but this will also reduce the sensor’s sensitivity, dynamic range and accuracy. Another option is to use a sensor with two measurement paths, which can keep the diode operating in its square-law region for all power levels. These wide dynamic range sensors, such as the Keysight E9300 E-Series, have two measurement paths, one covering -60 to -10 dBm and the other (with built-in attenuator), -10 to +20 dBm.
Peak power of modulated signals using diode-based sensors
Measuring the peak power of signals with pulsed and modulated signals requires two levels of signal detection. First the RF modulated signal is detected using the diode sensor and converted to a wideband signal representing the time-varying envelope of the modulated waveform. The second detection occurs when the wideband signal is sampled at a high rate and processed. Amplitude corrections can then be applied to the samples by adjusting the measured power to match the square-law, transition or linear regions of the diode sensor’s operation.
Tuned receiver power measurements
You can also use a spectrum analyser to measure average power. Handheld instruments like the Keysight FieldFox can take this measurement with a good degree of accuracy (typically ±0.5 dB across its frequency and temperature.)
Figure 4 shows a spectrum analyser being used as a tuned receiver for power measurements.
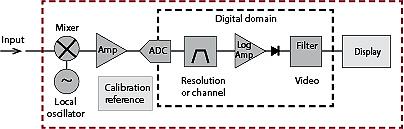
Figure 4: The architecture of the tuned receiver used in spectrum analysers
The front end of the circuit has a down-conversion block using a mixer and local oscillator. There is also a bandpass filter before the amplitude detector. This architecture converts the RF input signal to a lower frequency, at which it can be more easily filtered and detected.
Spectrum analysers, such as the FieldFox, use this approach to enable them to display the power of a signal as a function of frequency, by sweeping the local oscillator across a range of frequencies.
This approach also uses an ADC to sample the down-converted intermediate frequency (IF) for filtering and detection in the digital domain, in this case in two stages.
In the first, there’s a bandpass filter with an adjustable bandwidth which, in a spectrum analyser, is referred to as its channel or resolution bandwidth (RBW).
The next stage is for the signal’s amplitude to be detected and low-pass filtered. In an analyser with a digital IF, the diode detector is actually an algorithm in the instrument’s firmware that simulates an ideal square-law detector.
One of the advantages of spectrum analysers over power meters is their frequency selectivity, that is the ability to measure the power in a particular RBW. This enables spectrum analysers to measure lower power signals than power meters, by selecting a narrow RBW. Whereas a power meter may be able to measure down to -70 dBm, the FieldFox spectrum analyser can measure down to -154 dBm/Hz and has a dynamic range greater than 105 dB.
It is important to understand the principles of measurement so that you know which tools are appropriate for your purpose, and how their results should be interpreted. RF power meters and spectrum analysers each have advantages and disadvantages, but understanding these and making the right choice of approach will ensure that you get the right levels of accuracy, repeatability and traceability for your RF and microwave signal power measurements.
Author profile
Giovanni D’Amore is marketing brand manager at Keysight Technologies.


