
With the advent of the fifth generation of mobile communications, network testers are confronted with a novel situation. Many aspects of 5G – diverse frequency bands, network operators’ different rollout programs, the breadth of applications such as IoT, conventional mobile communications, traffic networking, and so on – are leading to highly differentiated networks and test data.
Analysing this data in the usual aggregated form quickly leads to distorted results and incorrect interpretations. AI is able to offer a good solution to this dilemma. Algorithm based methods only reflect specific theories.
These may not be ideal, but the data itself is reliable. AI methods, such as pattern recognition, are able to evaluate data sets without preconceptions and discover relationships that would remain hidden to human analysts.
Big data needs AI
The term “artificial intelligence” has been bandied about a lot in recent years, often without a clear definition of what it means, and with no differentiation between systems that are able to learn (a characteristic of AI) and systems that are simply based on complex algorithms.
The term “machine learning” is a bit more specific. Here the goal is to automatically derive general rules from a large volume of data. After completion of the learning process, yes/no decisions can be made based on multidimensional dependencies or features.
The decision rules are learned by approximating between real data points rather than being formulated by human experts. This method requires very large data volumes and an intensive training phase. But in the application phase, it is able to correctly interpret new measurement data almost spontaneously.
Supervised and unsupervised learning
Machine learning can be roughly divided into two types: supervised and unsupervised.
The goal of supervised learning is to find statistical relationships between the data and events or predefined labels in order to generate estimations for unknown inputs. A widely used application is object recognition, in which the presence and position of a particular object in an image (e.g. “A cat is/is not present in the picture”) is determined through multi-stage interpretation of patterns (edges, coloured areas, etc.).
For training, the learning software is presented with images labelled by humans and works out characteristics that allow decisions to be made. These rules are concealed in the neural network of the AI system rather than being formulated in algorithms.
An example of non-visual pattern recognition is the determination of the call stability score (CSS) for network tests.
Unsupervised learning works without labels. The algorithms have to independently recognise patterns or multidimensional data aggregates in order to derive usable conclusions from them, for example with the aim of measuring differences between new and known data points. A typical task for unsupervised learning is anomaly detection, which identifies unusual data without the support of experts.
AI methods
In response to the needs of network operators Rohde & Schwarz uses AI methods for applications such as simplifying the optimisation of mobile networks or improving the assessment of qualitative differences between providers.
The Data Intelligence Lab established in 2018 tackles these issues and supports Rohde & Schwarz R&D departments with data based analysis methods. These approaches are especially promising for testing mobile networks where particularly large amounts of data are generated, so that manual analysis and rule formulation are no longer practical. Machine learning makes it possible to use the information hidden in large data sets, for example to derive new assessment metrics. An example is the call stability score.
Call stability score
The call stability score is a new assessment metric for reliable communications. A suddenly dropped phone call is an annoying experience, so that is why mobile network operators have been testing voice quality and connection stability for many years.
The most popular statistic is the call drop rate (CDR). But since the number of dropped calls is very low in mature networks, it is necessary to make a large number of calls in order to obtain a statistically significant value. Consequently, drive test campaigns are long and expensive.
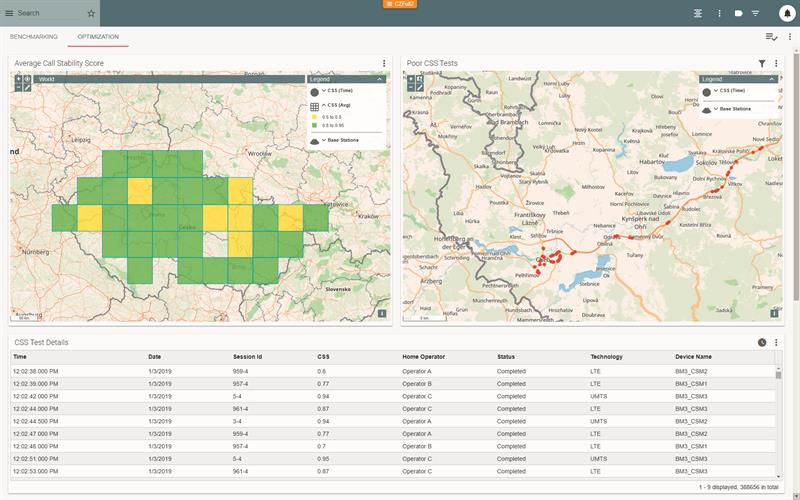 Above: Display of a network optimisation scenario using the R&S SmartAnalytics analysis software’s call stability score. Average CSS values are shown on the upper left, arranged by region. On the upper right, especially low scores are marked for later analysis. The exact values are listed in the table with additional information (shown here are sample results for demo purposes).
Therefore, Rohde & Schwarz uses a method to replace the binary call status (either successfully completed or dropped) by a finely graduated analogue value. This is done by creating a statistical AI-generated model that links the transmission conditions with the call status.
The CSS derived from the model allows the reliability of the mobile connection to be measured over the entire call duration and classified based on quality.
The diagnostic also includes unstable calls that were successfully completed but the data proves they were not far away from being dropped. In conventional CDR statistics, those unstable calls would be assessed positively as successful calls, distorting the network quality assessment.
The CSS value is based on information gathered from millions of test calls and incorporated in the model during the learning process. The assessment is conclusive right from the first call. The network call quality is registered more accurately and with less test effort.
In practice, every nine seconds of a call, measurement data is sent to the statistical model as a time series. The model assesses the data based on the learned rules and outputs a number between 0 and 1.
The higher the number is, so the lower the likelihood of a drop occurring in that nine-second interval. The CSS measurement is part of the R&S SmartAnalytics analysis platform,
Another AI-driven function in this software suite is anomaly detection using unsupervised learning. In both cases, the use of artificial intelligence leads to results that are not possible with conventional means.
AI methods will be used more and more in the future to maximize exploitation of the information content of measurement data.
Author details: Dr. Alexandros Andre Chaaraoui is Data Scientist and Project Leader, Rohde & Schwarz


