
With millions of devices out in the field in all kinds of conditions, bugs in the embedded code are even more likely to show up at one time or another. It is also more difficult to identify and fix those bugs when the embedded systems are out on the road or part of a supply chain on the other side of the world.
This is potentially a huge problem. Research from 13,500 software projects found that the defect removal rate was 95%. While this sounds pretty impressive from the engineering perspective, it still means 5% of defects end up out in the field. With 50-100 bugs typically introduced per 1000 lines of code, this means there can be 25 to 50 major bugs in a system of 50,000 lines of code.
As projects get bigger, combining embedded control and cloud systems across the latest industrial automation systems and the IoT, this problem keeps getting bigger, too. While engineers do their best not to introduce bugs in the first place and use extensive testing to remove all the bugs they can find. And this is where the key lies – how to find the bugs, especially when they can show up unexpectedly.
When embedded systems are deployed in things that move around, whether that’s in smart bins for collecting refuse or monitoring the cold chain delivering vaccines to tackle the Covid-19 pandemic, all kinds of different situations may occur. Some things can create a problem, and the developers behind the software need to know.
The bug may not be obvious, but it may be a precursor to a bigger problem. Catching problems early before the issue becomes catastrophic is ideal, especially if this can be done without the customer or user even noticing.
The same forces acting to drive the connectivity of embedded systems can also be used for identifying and reporting any potential problems. For example, monitoring the ambient and air temperature across an entire cold chain distribution highlights weak points that can be addressed, and ensures that products, including vaccines, arrive effective at the point of use without having been compromised. This requires extensive monitoring and logging, with data uploaded to the cloud for analysis.
Similarly, smart refuse systems use sensors and wireless links to determine when a bin is full and needs to be collected, rather than relying on a set schedule. Fleet management software and intelligent routing then determine the most cost-effective retrieval method, day by day.
The cost of a bug in such systems can be dramatic. While one trash bin not being collected is not a disaster, angry calls from customers with overflowing bins is not what an operator wants to deal with. It is also vital to know whether a sensor node has failed as a result of the sensor, the link or other parts of the system.
Losing a batch of vaccines that might have been compromised during transit is much more significant, especially if this is the result of a sensor failure. And if a sensor fails, there is no way of knowing whether the batch has been compromised or not.
Catching errors
So catching errors as they occur and notifying developers is of tremendous value to enterprises. The average cost of fixing bugs in an embedded device’s first year of service alone can run into hundreds of thousands of dollars, and this does not include damages caused by bugs.
One method that is of tremendous value to the developer at the benchtop is visual trace diagnostics. This gives a visual timeline of the internal software events during operation and is a key tool for a developer tracking down bugs. The trick is to bring this data out during deployed operation and provide the developer team with detailed information about software issues in the field.
This is where the cloud integration comes in. As more nodes are connected in the IoT, that same channel can also be used for diagnostic data. The cloud connection can be used to alert developers when an error is first detected and provide visual trace diagnostics to identify the root cause.
This is a powerful concept that not only highlights when a node fails, but it also provides an explanation – the timeline of software events just before the issue was detected, showing what led up to the problem. This way, the software can be corrected and updated quickly, while only a few customers have been affected by the bug, and thereby avoid a much larger problem.
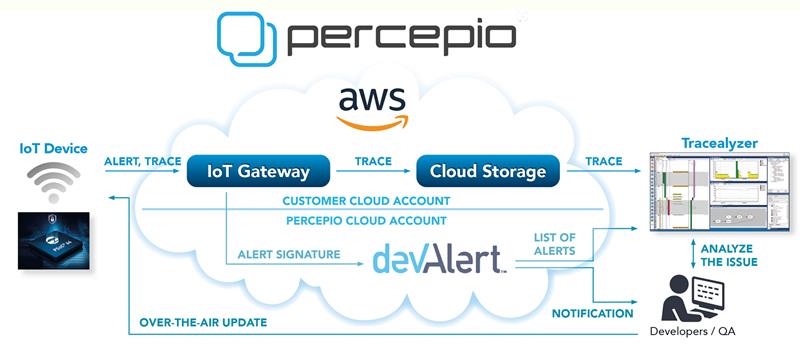
This concept is the heart of a tool called DevAlert. In combination with the visual trace diagnostics technology Tracealyzer and a sophisticated cloud data management system, it can be used to monitor any kind of IoT connected device.
When something unexpected happens, for example if the system automatically rebooted to recover from an error, the events that led to the reboot are captured and available. But it is the awareness that is the key. When developers receive an alert, they can immediately look at the diagnostic trace information and see exactly what happened.
By including a trace with the alert, it becomes much easier to identify the situation that caused the problem. When you add visual trace diagnostics, including many types of visual overviews, it becomes even easier for developers to understand the problem. This allows developers to find the root cause and fix the problem quickly. The reaction time matters. Most bugs in deployment don’t show up directly for all users, otherwise they would surely have been found during the testing. So the faster an update can be provided, the fewer customers will be affected.
This is particularly helpful as the customers won’t necessarily report a problem and provide the information that a developer needs to reproduce and fix the bugs, especially for consumer devices. Even when a bug is reported, it can be with very vague information, leaving a developer at a loss on where to start.
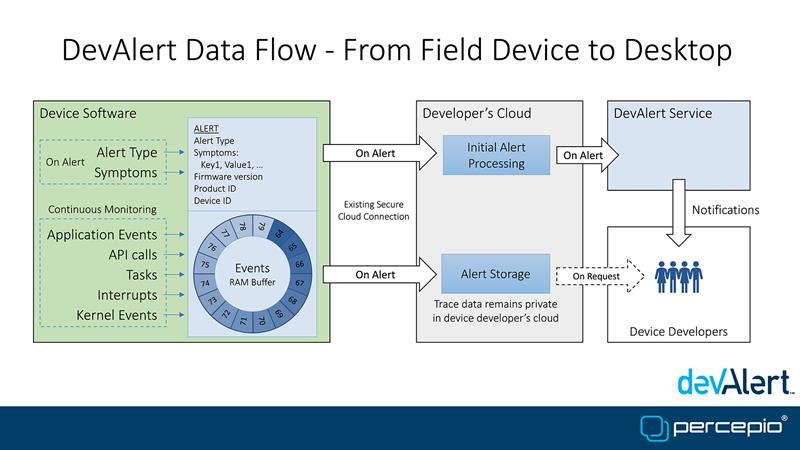
The concept involves three software components. The DevAlert Firmware Monitor (DFM) is a compact software library that device developers embed in their RTOS-based IoT application. This agent keeps a trace of recent software events and provides a way for error-handling code in the application to report any condition of relevance to the device developer, errors, proactive warnings or other diagnostic information, whether related to software or hardware. The alert message is then uploaded to the cloud account of the device using an existing secure connection, such as MQTT over Transport Layer Security (TLS).
But the DFM monitor on its own could just deliver a deluge of data. The DevAlert cloud service takes that data and looks at error codes and any other symptoms and notifies the developers in case of a new unique issue if a new combination of symptoms has happened. This avoids the problems of duplicate alerts flooding a developer. Percepio’s Tracealyzer tool can then be used by the developer back in the lab to analyse the provided trace.
It is important to understand that DevAlert in no way replaces conventional testing; you need both, just as most cars have both seat belts and air bags. Good, systematic testing typically removes 95% of the bugs, as we stated above. Error reporting in the field will help you catch those bugs that testing couldn’t find, the difficult ones that only appear under certain conditions. There is often an astronomical number of potential scenarios in the software, that depends on the inputs, the software timing, device settings and other environmental factors (e.g. the Wi-Fi connection). Any one of these may have latent bugs, that may cause the device to crash or produce incorrect data. For example, some device might fail if the Wi-Fi connection receives multiple packets within 5 milliseconds while it is busy writing data to a flash memory.
Author details: Johan Kraft is CEO and Founder at Percepio


